







Most Common Configuration
4
Partitions
42.86%
of sample devices
Data Recovery Wizard for Windows
Recover lost data from HDD, SSD, SD cards, USB drives on Windows PC.
Recover lost files from Mac SSD, Time Machine backups, memory cards, Trash, and external storage devices.
Recover Lost iPhone/Android Data – Photos, Messages, Contacts & More in 3 Clicks.
Windows partition manager: create, resize, clone partitions and upgrade HDDs/SSDs safely.
Windows Backup Freeware - One-click system, disk, and file backup with reliable recovery for peace of mind.
PC data transfer software: transfer data, apps, user account and personal files to new PCs and disks.
Remove vocals from songs and separate vocal and instrumental tracks from audio or video with AI.
Capture any area of your screen with customizable settings and record video/audio/webcam.
Channel Partnerships
Affiliate Earn commissions when you drive sales through your affiliate links. Resellers Sell EaseUS products as a distributor. Creators & Influencers Partner with us on YouTube, TikTok, Twitch to earn commissions. OEM & Outsourcing Service Put your brand on EaseUS software, or get custom solutions.Self-Service
Manage your products, licenses, and subscriptions in one place. Find guides and resources for quick self-service.
Live Chat Support
Get real-time answers from our experts.
Premium Human Services
Human-led solutions for complex system & data emergencies.
The Windows storage structure has been varying in recent years, so it is to the global disks users' storage environment. Due to the rapid increase of SSDs, the growth of multi-drive configurations on PCs, and the gap between physical disk capacity and C: drive capacity, it can no longer adequately describe disk users' actual storage experience by knowing "how big their disk drives are".
EaseUS Lab, with its EaseUS Partition Master R&D team and Tech Support team, collected 3.8 million Windows user samples and spent 3 months studying, interpreting, and analyzing them. Based on this, EaseUS Lab produced the insights report Windows Storage Trends and Insights of 2026 H1 (2026.2 - 2026.7), which covers global Windows users' device storage configurations, HDD and SSD usage, physical disk capacity, C: drive capacity, storage pressure, and regional differences. Here is a quick glance at this report:
| Insights Items | Data/Percentage | Key Insights/Discovers |
|---|---|---|
| Samples | 3,796,254 | Nearly 3.8M Windows user samples |
| Physical Disks | 6,575,391 | Each average device installs with 1.73 internal disks |
| SSD Share | 63.03% | SSDs have become the dominant storage media |
| HDD Share | 33.17% | HDDs still have a substantial user base |
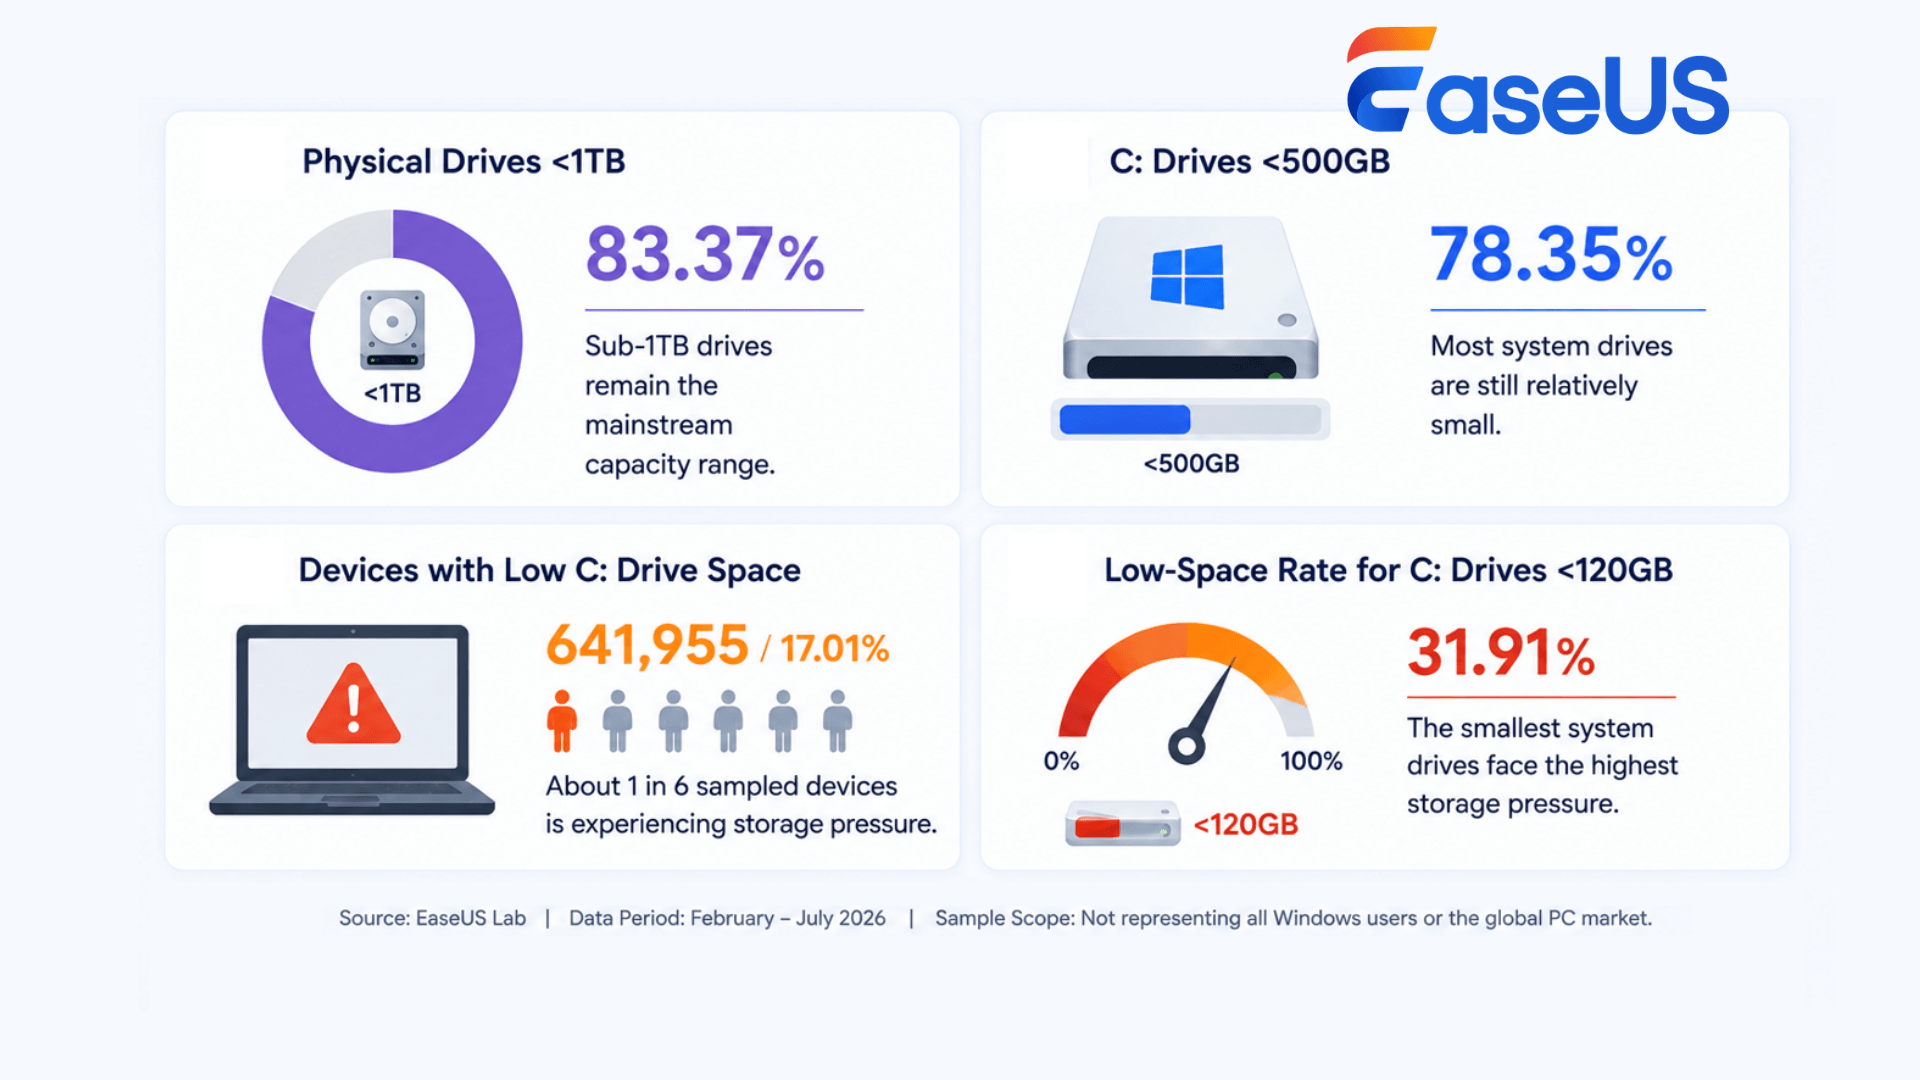
According to this data report, trends in Windows storage are clear: SSDs have become the primary choice for system drives, multi-drive setups keep growing, and 250GB-1TB is the major range of physical storage capacity. Still, the physical disk capacity doesn't equivalently match C: drive space, and the system drive space has become an essential factor affecting users' storage experience.
Notably, 83.37% of internal disk drives are smaller than 1TB, and 78.35% of C drives are smaller than 500GB. Plus, among the sample data, 17.01% of sample drives have a "C: drive turning red" issue with less than 10% free space, which reveals a trend that storage pressure surges as disk capacity decreases.
These "changes" indicate that Windows storage is switching from claiming "more capacity" to focusing on "How to allocate, use, and manage disk storage space". The differences in original disk capacity further illustrate that global demand for Windows storage is becoming more diversified.
This insights report is based on nearly 3.8 million Windows samples in the first half of 2026 collected by the EaseUS Lab, and this study aims to learn the actual storage configurations of Windows users and identify the emerging trends in global disk storage capacity and usage.
This insights report mainly focuses on 6 key areas, including:
EaseUS also provides forward-looking insights into global Windows storage trends, along with suggestions for Windows users, disk administrators, and disk storage manufacturers on how to use and manage disk drive space smartly.
The goal of this insights report is to help global Windows and disk owners address most storage issues, including insufficient or not enough space on disk drives, C drive full, C drive red with low disk space error, system stuck or freezes, PC stuck on loading games, and PC startup or shutdown slow, etc.
Nearly 3.8 Million Samples Reveals New Patterns of Windows Storage
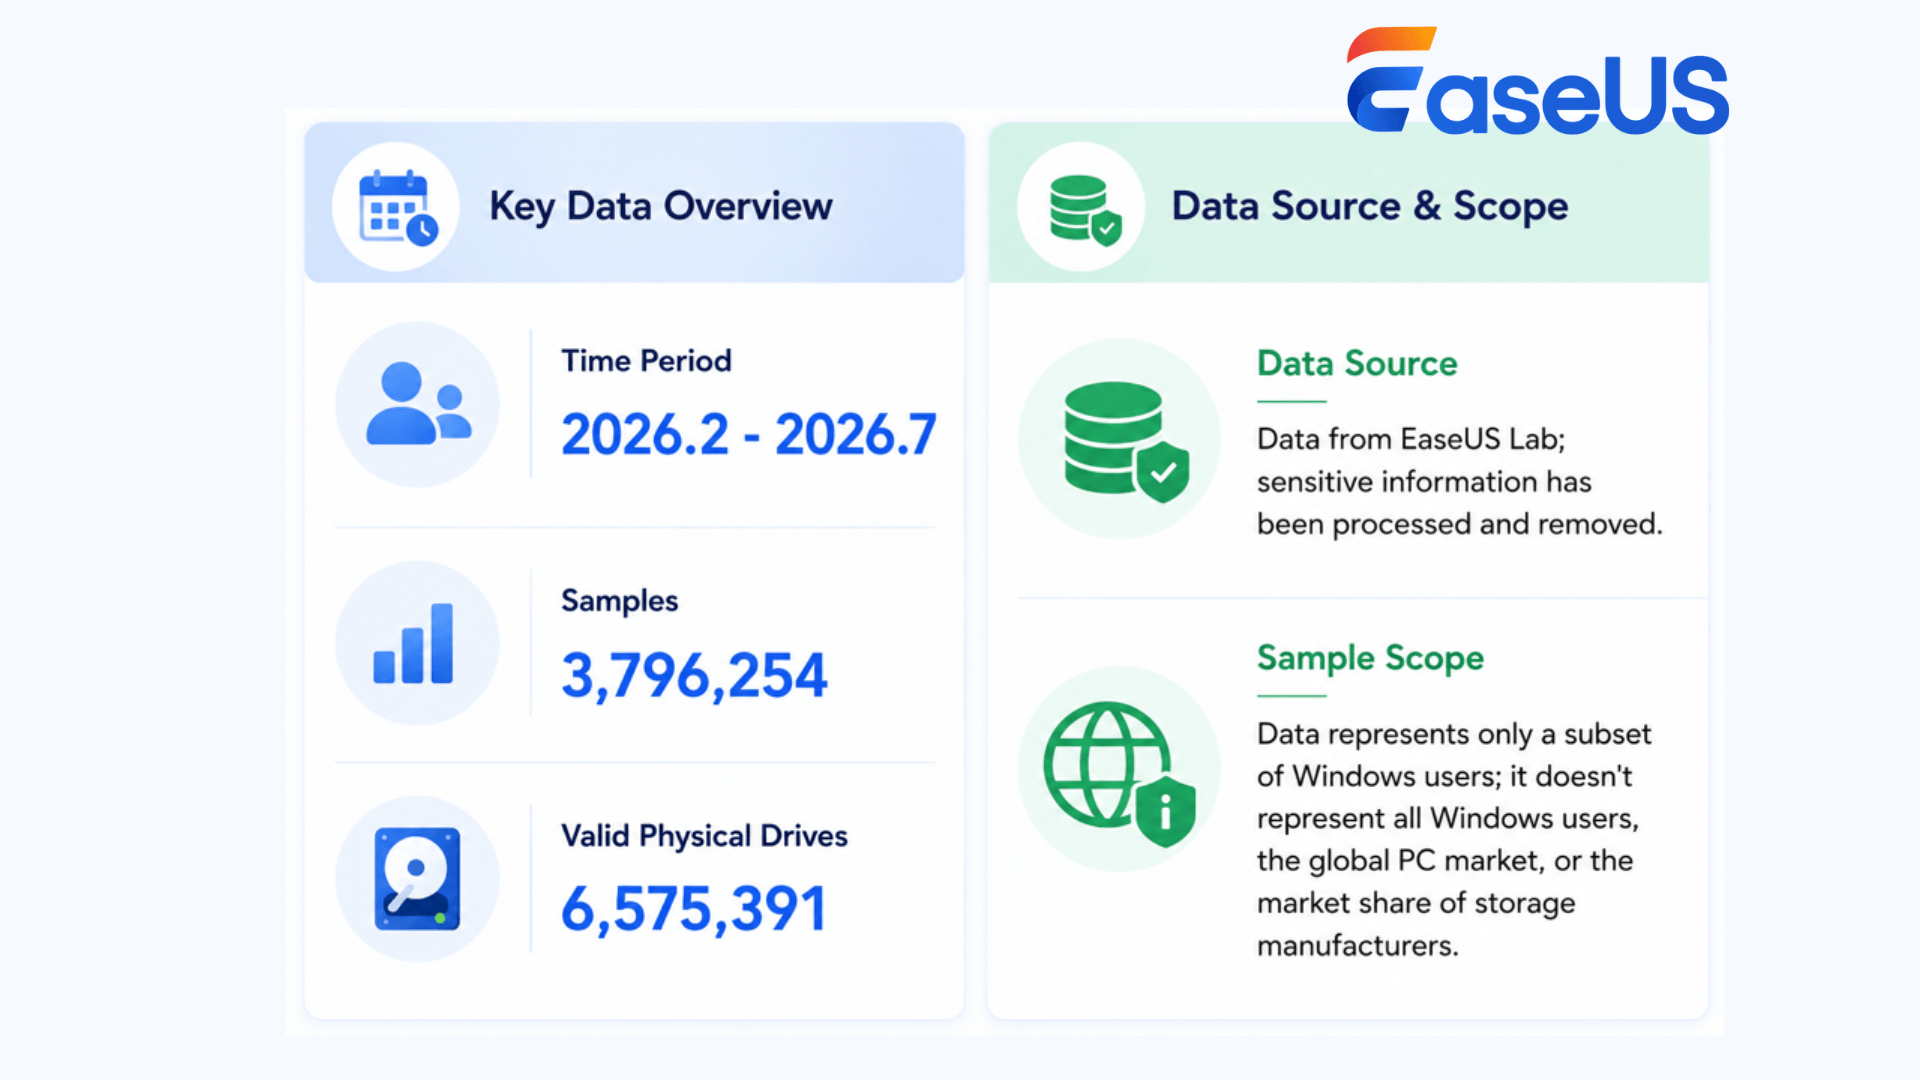
This study covers 3,796,254 samples collected from February 2026 to July 2026, along with 6,575,391 valid internal physical drives. Each sampled device has an average of 1.73 internal drives, showing a clear trend toward multi-drive storage configurations.
| Items | Briefs |
|---|---|
| Time Period | 2026.2 - 2026.7 |
| Samples | 3,796,254 |
| Valid Physical Drives | 6,575,391 |
| Data Source | Data from EaseUS Lab; sensitive information has been processed and removed |
| Sample Scope | Data represents only a subset of Windows users; it doesn't represent all Windows users, the global PC market, or the market share of storage manufacturers. |
Key Takeaway:
Windows storage is shifting from a single-drive setup to a multi-drive setup or more diverse configurations. The number of drives installed on a device and the storage capacity of disk drives are becoming important metrics for indicating and understanding changes in storage devices.
The storage configurations of Windows devices are becoming more diverse. In this insights report, over 44.85% of sampled devices have two or more internal drives, while total storage capacity tends to expand to 1TB or more.
This suggests that Windows users are moving toward multi-drive setups and better overall storage allocation instead of simply seeking "more storage". In this section, we'll examine this shift from two perspectives: the number of internal drives and the total storage capacity per device.
44.85% of Sample Devices Have Two or More Internal Drives, Showing a Shift Toward Multi-Drive Storage
A single internal drive accounts for 55.15% of sampled Windows devices and remains the most common setup. Still, over 44.85% of sample devices have two or more internal drives: 28.94% are two-drive setups, and 15.92% have three or more drives.
| Number of Internal Drives | Share of Sample Devices |
|---|---|
| 1 | 55.15% |
| 2 | 28.94% |
| 3 | 9.06% |
| 4 | 3.88% |
| ≥5 | 2.98% |
Key Insights:
In a word, Windows storage is shifting from "one drive for system and data" to "multiple drives for different storage demands." This change suggests that proper space allocation, combined with smart space management, could become a future trend in disk space management.
Mid-Range Storage Still Remains Dominant, But the Bigger Capacity Devices Are Growing
According to the following table, although mid-range internal disk storage still makes up the majority, total storage capacity is shifting toward higher ranges. 250GB - 2TB is the major internal storage range of Windows devices: 25.74% of devices are using 250GB - 500GB, followed by 500GB - 1TB at 20.88% and 1TB - 2TB at 18.55%. Larger-capacity storage is becoming more common.
| Internal Disk Storage Capacity | Share of Sample Devices |
|---|---|
| <250GB | 16.82% |
| 250GB - 500GB | 25.74% |
| 500GB - 1TB | 20.88% |
| 1TB - 2TB | 18.55% |
| 2TB - 3TB | 6.87% |
| 3TB - 4TB | 3.10% |
| ≥4TB | 8.04% |
Key Insights:
Overall, Windows storage is now showing a clear trend of "multi-drive setups with larger storage capacity", even though the mid-range storage is currently still a dominant configuration.
So, if we divide internal storage devices into HDDs and SSDs, what's the share of HDDs and SSDs? An interesting discovery: the roles of different storage media are becoming more clearly defined in Windows devices. About 63.03% of SSDs are being used as internal physical drives, and the share of SSDs even rises to 79.73% when used as the system C drive. SSDs have become the primary choice for Windows system drives.
Meanwhile, only 33.17% of HDDs are installed as internal storage, showing their continued role in existing devices and for high-capacity storage. Windows storage is gradually shifting toward a multimedia model, with SSDs mainly used for the system and PC performance, and HDDs continue to provide storage capacity for data and other purposes.
SSDs Are Taking Over System, Yet HDDs Are Not Going Away
Across all internal physical sample drives, SSDs have now made up the majority, while HDDs still maintain a significant share. For the physical drives that contain the C drive, SSDs have taken dominance. Meanwhile, HDDs remain the first choice for Windows users for high-capacity data storage.
In short, SSDs are not "replacing" HDDs in Windows storage media, but becoming a more common storage strategy: SSDs are for system and PC performance, while HDDs continue to serve existing devices and large-scale of data storage.
| Sample Drive Type | SSD | HDD | Other |
|---|---|---|---|
| Internal Physical Drives | 63.03% | 33.17% | 3.80% |
| Physical Drives with System C: | 79.73% | 17.79% | 2.48% |
Key Insights:
According to the internal storage sample shares, SSDs have become the dominant internal storage medium, while HDDs still maintain a significant presence. As for physical drives containing the system drive, SSDs account for 79.73%, playing the leading role as Windows C: drives.
This storage structure doesn't indicate that SSDs are "replacing" HDDs, instead, this trend shows that these two types of disk drives are taking on different roles:
83.37% of Physical Drives Are Smaller Than 1TB, Mid-Range Storage Remains the Mainstream
By digging deeper into Windows physical storage drives, it's clear that most internal physical drives in Windows devices are still smaller than 1TB, without a sign of a shift to ultra-high-capacity disks. Among those disks, 29.03% of disks have 250GB - 500GB of storage, while 500GB - 1TB take up 28.07%. Together, these two ranges of storage capacity account for more than half of all internal sample disks and are the two dominant storage capacity ranges.
| Internal Physical Drive Capacity | Share of Drives |
|---|---|
| <250GB | 26.26% |
| 250GB - 500GB | 29.03% |
| 500GB - 1TB | 28.07% |
| 1TB - 2TB | 10.13% |
| 2TB - 3TB | 1.03% |
| 3TB - 4TB | 3.33% |
| ≥4TB | 2.13% |
Key Insights:
To sum up, Windows storage still uses 250GB- 1TB as the core mainstream storage capacity range, with no significant shift to high-capacity drives. The 250GB - 500GB and 500GB - 1TB ranges seem to form two equal major capacity groups.
Also, high-capacity storage already takes up some market share but has not become mainstream yet. Moreover, disk users with capacity smaller than 250GB make up 26.26% of all samples and may face greater storage stress and space-management challenges.
4 Partitions Are the Most Common Setups, Forming a Stable Windows Partition Structure
Alongside disk storage capacity, how many partitions are used on average in Windows setups is another important part in understanding Windows storage. 4 partitions are the most common configuration, accounting for 42.86% among system sample disks with a single C drive. Also note that partitions include EFI, Recovery, and other hidden system partitions, which makes the actual structure of a Windows system drive more complex than users can visibly see, such as C: and D:.
Key Insights:
From this part, it's clear that Windows system partitions are forming a stable multi-partitioned structure, with 4-5 partition configurations. Users who are using this partition structure may have a growing demand for smarter space management and more efficient space utilization. Also, remember that the number of partitions is not the same as the number of drives users can see, as the system-related partitions also include EFI and Recovery partitions.
The overall Windows storage capacity is increasing, but having more physical storage doesn't necessarily mean having more available system space. According to C drive storage data, system storage is still concentrated in small and mid-range capacities. It's clear that C drive capacity has a distinct distribution and a strong connection to the actual available storage space on the system drive.
Therefore, to understand the Windows storage experience, it's necessary to dive deeper into this storage insights report, moving from merely focusing on "How big the C drive is" to considering "How much storage pressure it would be when the C drive capacity changes?"
78.35% of C Drives Are Smaller Than 500GB, System Storage Remains in the Small-to-Mid Capacity Range
According to the C drive capacity distribution, Windows system space still remains in the small-to-mid range. Over 78.35% of C drives are smaller than 500GB, and 60.28% use 120GB-500GB of storage capacity. Meanwhile, over 18.07% of C drives are smaller than 120GB, and only 4.86% are 1TB or bigger.
| C Drive Capacity | Share of C Drives |
|---|---|
| <120GB | 18.07% |
| 120GB - 250GB | 31.33% |
| 250GB - 500GB | 28.95% |
| 500GB - 1TB | 16.79% |
| ≥1TB | 4.86% |
Key Insights:
Apparently, current Windows storage shows a distinctive structural difference: physical storage continues to increase and expand, while system C drive capacity remains in the small and mid-range. Clearly, when devices are installed with large disk storage, it doesn't mean the system C drives have equally ample storage space.
The Mainstream C Drive Capacity Doesn't Significantly Change Due to The Increase in SSD Adoption
SSDs have become the primary storage media for Windows system drives. However, if we look at C drive capacity distribution, SSDs and HDDs share a similar pattern: both drive types take up a similar share while serving as system drives. Both HDDs and SSDs mainly use 120GB - 250GB as the C drive capacity range, which indicates that the mainstream system drive capacity doesn't change significantly when shifting between HDDs and SSDs.
| C Drive Capacity | SSD System Drive Share | HDD System Drive Share |
|---|---|---|
| <120GB | 17.73% | 17.35% |
| 120GB - 250GB | 32.59% | 25.82% |
| 250GB - 500GB | 28.35% | 32.31% |
| 500GB - 1TB | 16.32% | 19.90% |
| ≥1TB | 5.01% | 4.62% |
Key Insights:
Basically, the adoption of SSDs has indeed changed the storage structure of Windows system drives. However, it didn't drive system C drives to a larger capacity. Whether SSDs or HDDs are used as system drives, it still remains in the small-to-mid capacity range.
C Drives Smaller Than 120GB Is The Highest-Risk Range Facing "Low Disk Space" Error
Will storage challenges stay the same when C drive capacity varies? The answer is "NO". According to this insights report, we used "C drive with less than 10% free space" to define whether the C drive is about to "turn red"; about 641,955 sample devices have this issue, accounting for 17.01%. Still, the "C drive turning red" issue follows a capacity distribution pattern: the smaller the C drives, the higher the percentage that experience high storage stress.
C Drive Turning Red Definition: Less than 10% free storage capacity remains unused on the C drive.
| C Drive Capacity | C Drive Turn Red Rate |
|---|---|
| <120GB | 31.91% |
| 120GB - 250GB | 20.64% |
| 250GB - 500GB | 11.06% |
| 500GB - 1TB | 7.56% |
| ≥1TB | 6.27% |
Key Insights:
Clearly, the space pressure issue on the C drive is based on storage capacity distribution: smaller C drives are more likely to encounter low storage issues. Also, the risk drops significantly when the C drive capacity rises from less than 120GB to 250GB - 500GB, while it becomes gradual when the C drive storage reaches 500GB or more.
Global data show that mainstream disk drive capacities used by Windows users vary by region. In Europe, disk storage is mainly concentrated in the 500GB to 1TB range, while North America and Asia remain centered on the 250GB to 500GB range. This indicates that the Windows storage configurations are becoming more diverse across regions.
Looking further at the country and brand data, it's clear that the top countries in different capacity ranges vary, as do the top HDD and SSD brands.
🔖Note: These observations only reflect the storage configurations, regional and brand distribution found in the EaseUS Lab sample disks. Though these results illustrate some storage trends, they don't represent global market share, user choices, or brand preferences.
Europe Favors 500GB - 1TB, While North America and Asia Center on 250GB–500GB
Windows users show regional preferences for mainstream drive capacities. In the European samples, 500GB to 1TB accounts for 29.88%, making it the biggest capacity range. In contrast, the leading range in both North America and Asia is 250GB to 500GB, accounting for 28.32% and 32.54%, respectively.
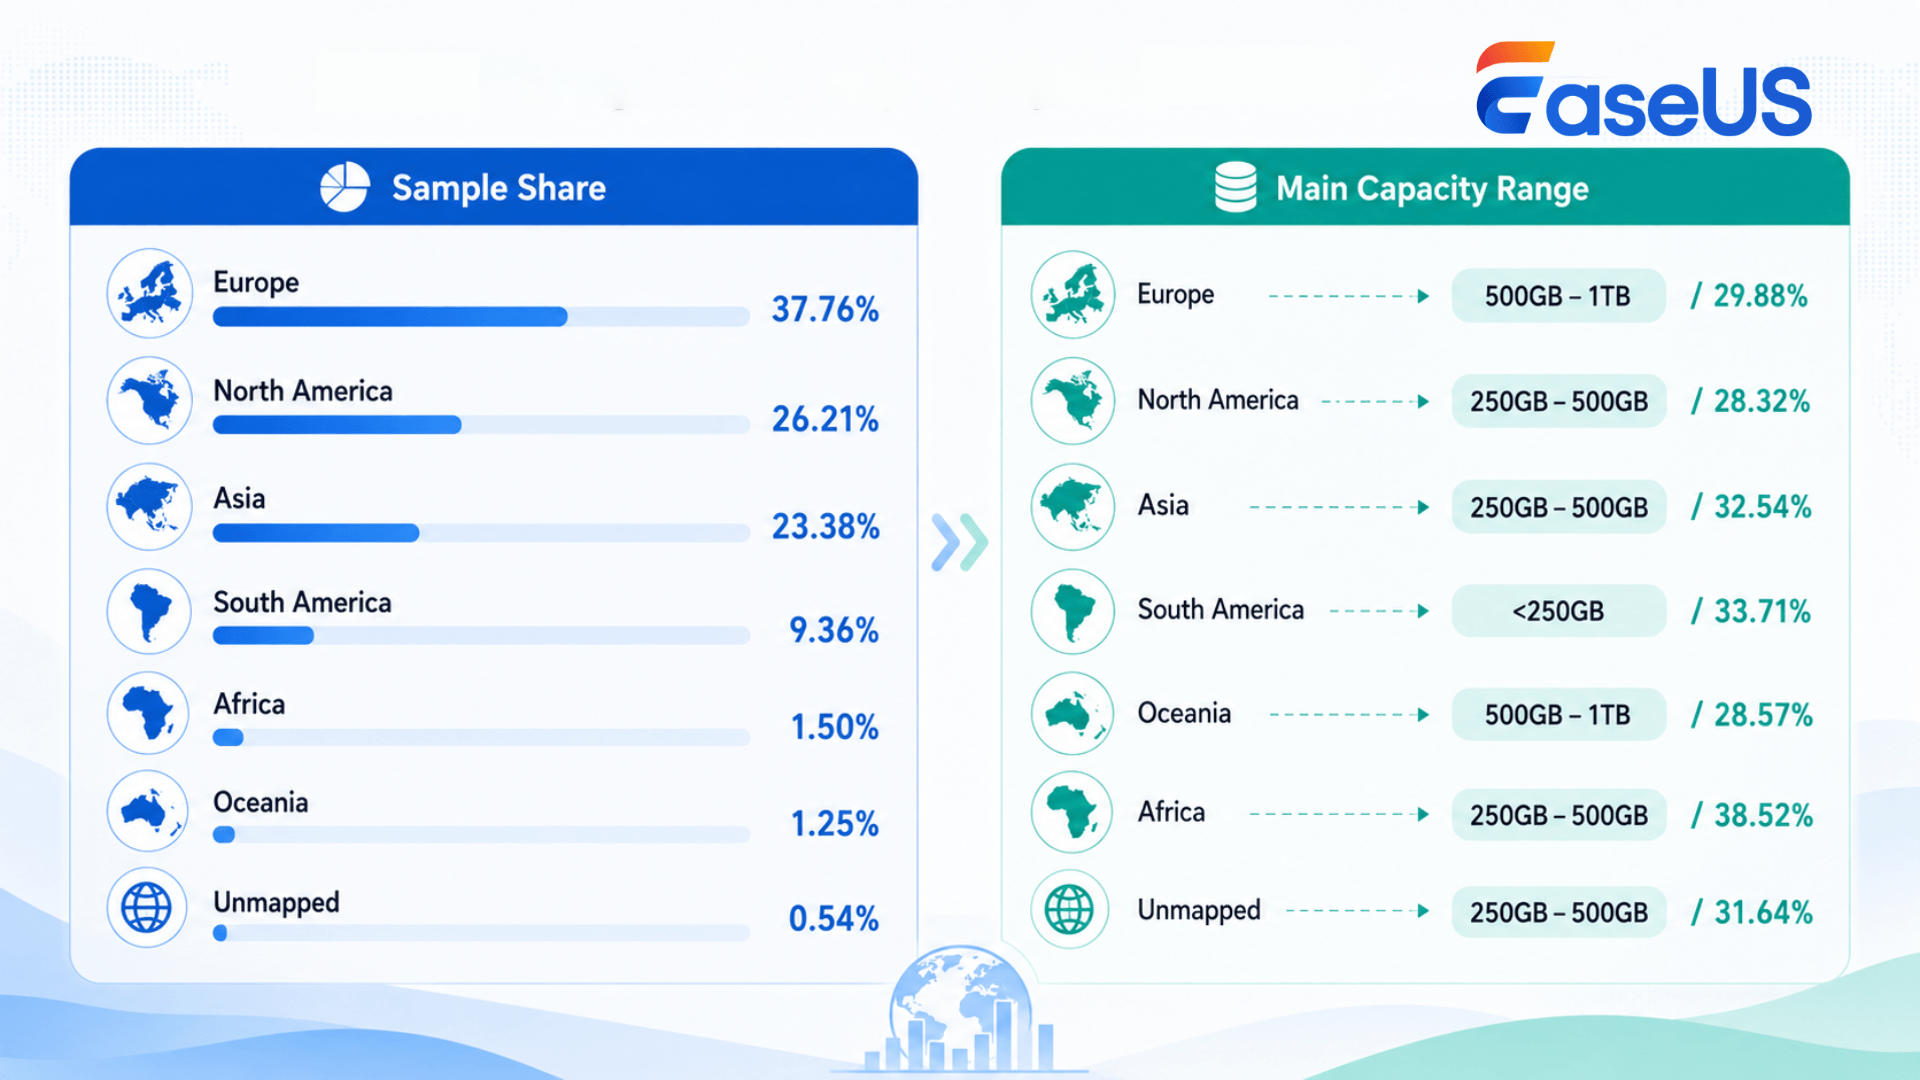
| Region | Share of Sample | Main Capacity Range | Share of Range |
|---|---|---|---|
| North America | 26.21% | 250GB - 500GB | 28.32% |
| Europe | 37.76% | 500GB - 1TB | 29.88% |
| Asia
|
23.38% | 250GB - 500GB | 32.54% |
| South America
|
9.36% | <250GB | 33.71% |
| Oceania
|
1.25% | 500GB - 1TB | 28.57% |
Africa
|
1.50% | 250GB - 500GB | 38.52% |
| Unmapped | 0.54% | 250GB - 500GB | 31.64% |
Key Insights:
Altogether, the mainstream storage capacity of Windows users shows clear regional differences. Europe prefers 500GB - 1TB; North America and Asia are centered on the 250GB - 500GB range, while South American users seem more likely to choose smaller disk drives under 250GB. According to the regional data, global Windows users have shown regional preferences for different storage capacities rather than tending to a single capacity range.
Europe Leans to Prefer Larger Drives, Asia Is More Concentrated in 250GB - 500GB Disks
While focusing on North America, Europe, and Asia, the storage structure shows even clearer differences in disk capacities. The leading capacity range in Europe is 500GB - 1TB, while North America and Asia center on the 250GB - 500GB range; as a result, the storage range preferences differ between the two regions.
| Region | Share of Sample | Main Capacity Range | Share of Main Range |
|---|---|---|---|
| North America | 26.21% | 250GB - 500GB | 28.32% |
| Europe | 37.76% | 500GB - 1TB | 29.88% |
| Asia | 23.38% | 250GB - 500GB | 32.54% |
Key Insights:
Clearly, the storage structures of sampled disks vary by region. European users have shifted to the 500GB - 1TB range; Asian users mainly prefer the 250GB - 500GB range, while North American users show a balanced choice between these two ranges for storage.
United States Ranks on Top in Major Capacity Ranges, While Germany Tends to Prefer Larger-Capacity Drives
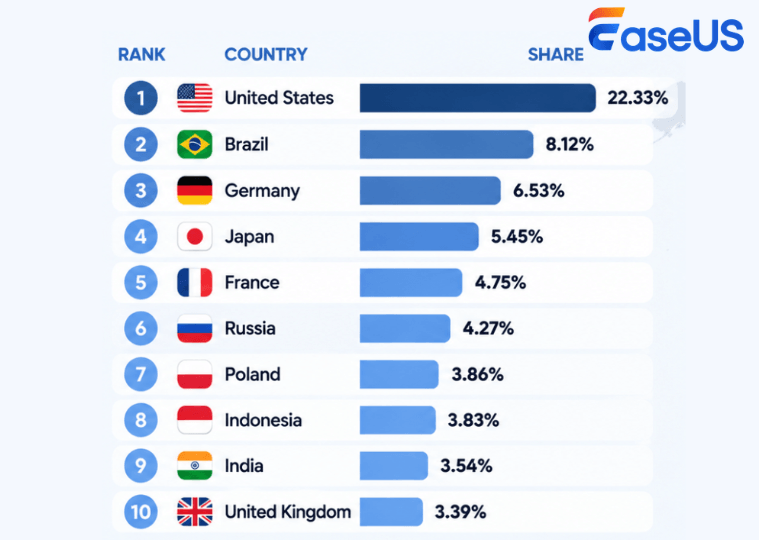
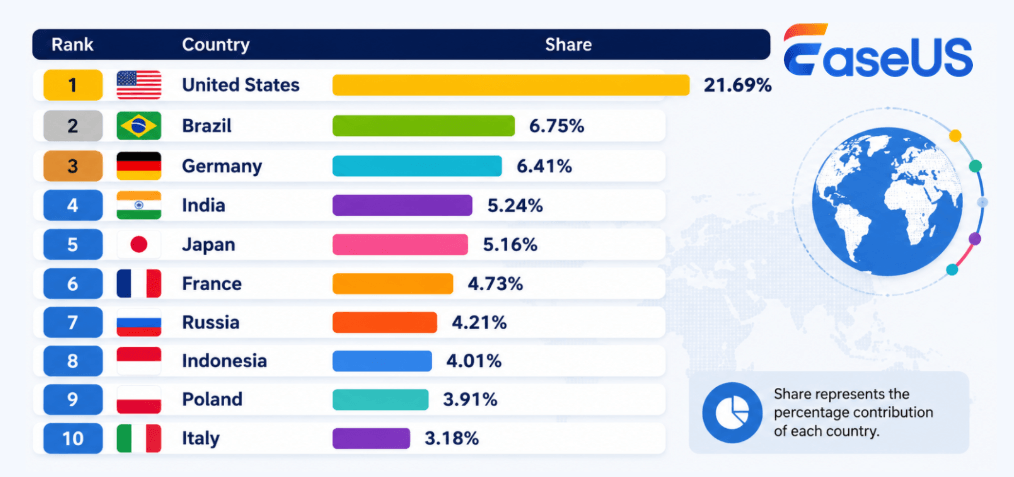
By breaking down the data by country composition in storage capacity, it shows that the distribution across countries varies in different capacity ranges. The United States ranks No.1 in all major capacity ranges, while Germany ranks higher in 500GB or bigger capacity ranges, making Germany an important sample source behind the United States.
Top 10 Countries/Regions Using Disk Drive Capacity Below 250GB
| Rank | Country | Share |
|---|---|---|
| 1 | United States | 22.33% |
| 2 | Brazil | 8.12% |
| 3 | Germany | 6.53% |
| 4 | Japan | 5.45% |
| 5 | France | 4.75% |
| 6 | Russia | 4.27% |
| 7 | Poland | 3.86% |
| 8 | Indonesia | 3.83% |
| 9 | India | 3.54% |
| 10 | United Kingdom | 3.39% |
Top 10 Countries/Regions Using 250GB - 500GB Drive Capacity
| Rank | Country | Share |
|---|---|---|
| 1 | United States | 21.69% |
| 2 | Brazil | 6.75% |
| 3 | Germany | 6.41% |
| 4 | India | 5.24% |
| 5 | Japan | 5.16% |
| 6 | France | 4.73% |
| 7 | Russia | 4.21% |
| 8 | Indonesia | 4.01% |
| 9 | Poland | 3.91% |
| 10 | Italy | 3.18% |
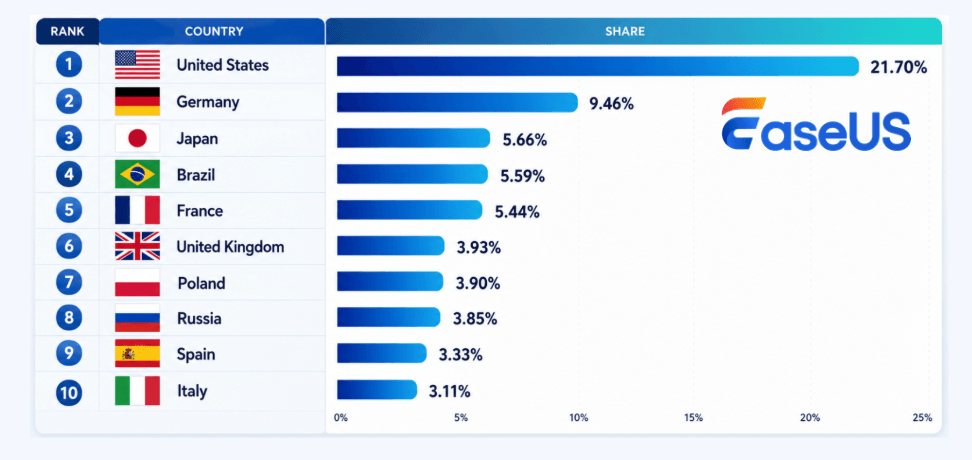
| Rank | Country | Share |
|---|---|---|
| 1 | United States |
|
| 2 | Germany |
|
| 3 | Japan |
|
| 4 |
|
|
| 5 |
|
|
| 6 |
|
|
| 7 |
|
|
| 8 |
|
|
| 9 |
|
|
| 10 |
|
|
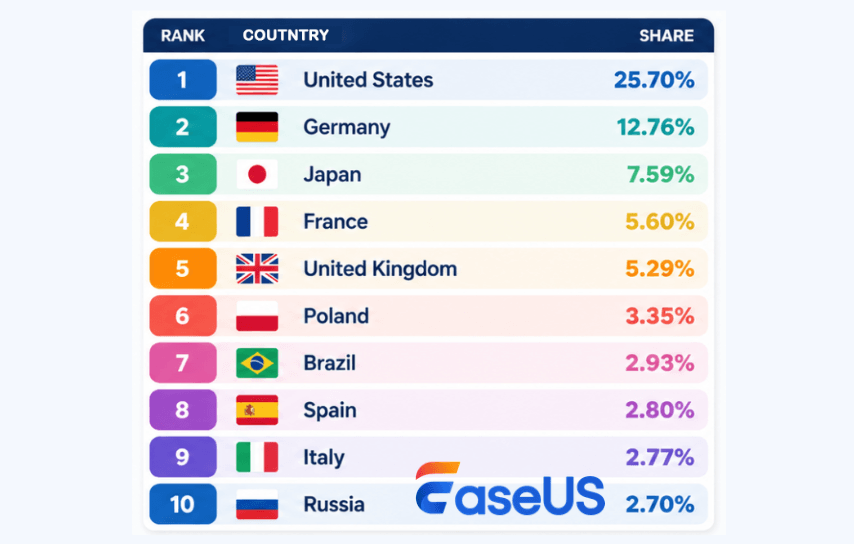
| Rank | Country | Share |
|---|---|---|
| 1 | United States |
|
| 2 | Germany |
|
| 3 | Japan |
|
| 4 |
|
|
| 5 |
|
|
| 6 | Poland |
|
| 7 |
|
2.93% |
| 8 | Spain |
|
| 9 |
|
|
| 10 |
|
2.70% |
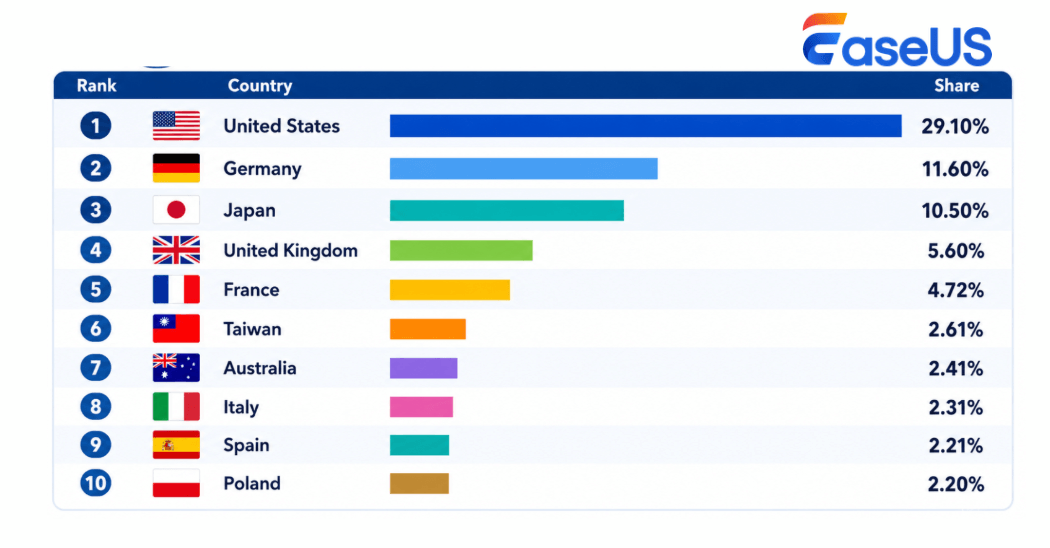
| Rank | Country | Share |
|---|---|---|
| 1 | United States |
|
| 2 | Germany |
|
| 3 | Japan |
|
| 4 |
|
|
| 5 |
|
|
| 6 |
|
|
| 7 |
|
2.41% |
| 8 | Italy |
|
| 9 |
|
|
| 10 |
|
2.20% |
Key Insights:
SSDs and HDDs Are Showing Different Brand Concentration
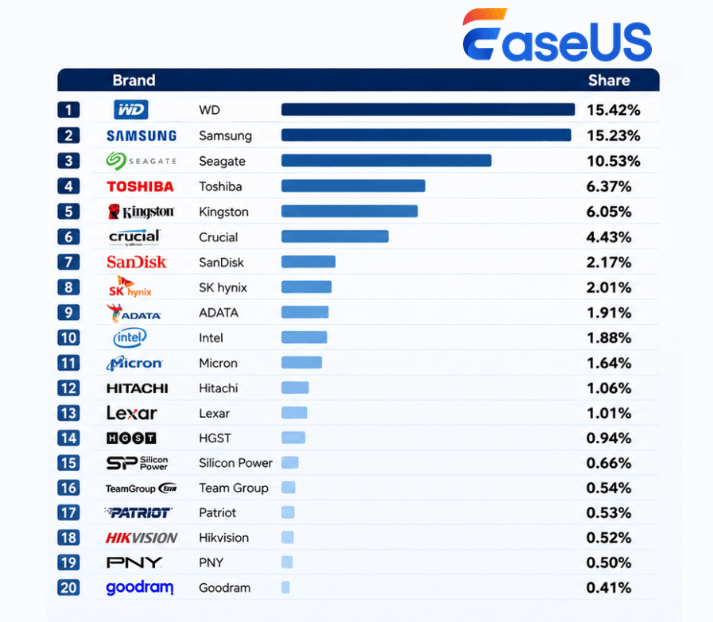
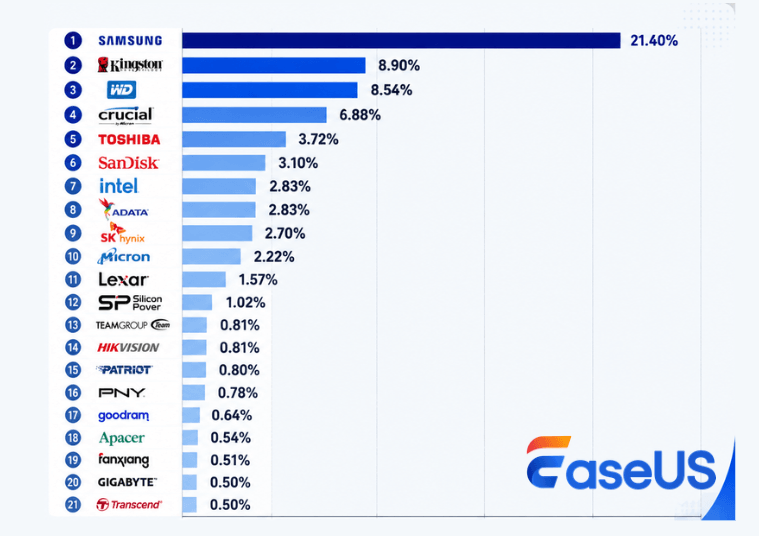
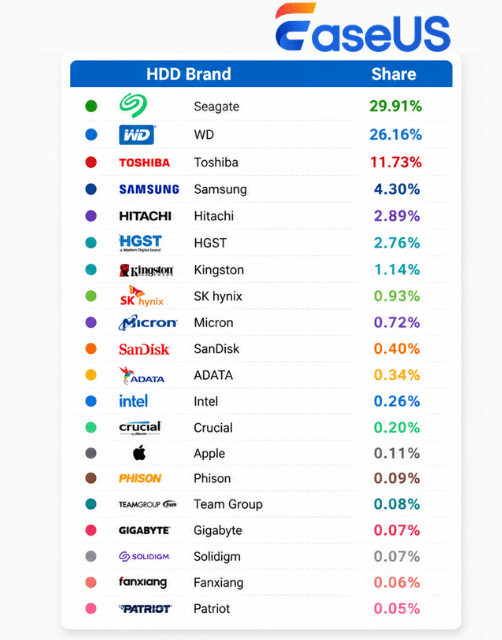
At the brand level, SSDs and HDDs have different brand structures. Among all sample physical drives, WD, Samsung, and Seagate have the largest shares. When analyzing SSDs and HDDs separately, Samsung has the largest share among SSDs, while Seagate and WD dominate the HDD segment.
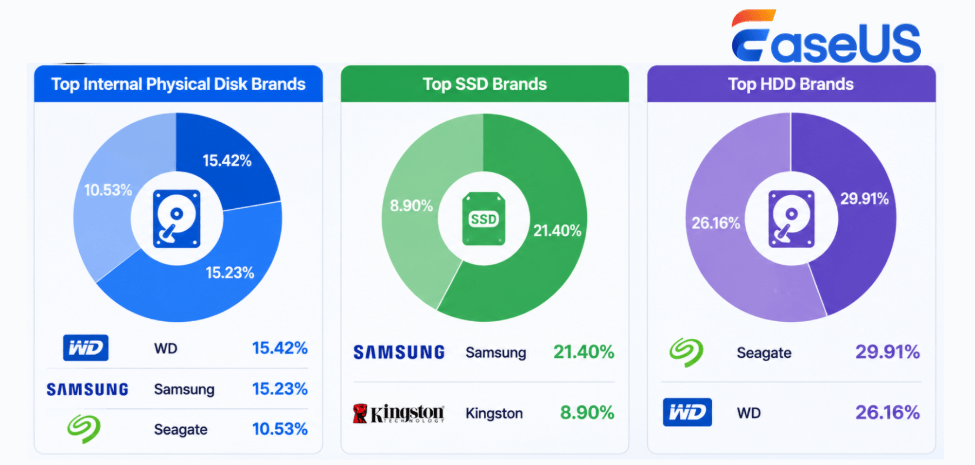
| Items | Brands and Share |
|---|---|
| Top Internal Physical Disk Brands |
WD: 15.42% Samsung: 15.23% Seagate: 10.53% |
| Top SSD Brands |
Samsung: 21.40% Kingston: 8.90% |
| Top HDD Brands |
Seagate: 29.91% WD: 26.16% |
| Top 20 Internal Physical Disk Brands and Share | |
|---|---|
|
 |
6.4.2 Top 20 SSD Brands
| Top 20 SSD Brands and Share | |
|---|---|
|
 |
| Top 20 HDD Brands and Share | |
|---|---|
|
 |
Key Insights:
To sum up, SSDs and HDDs are sharing clearly different brand structures. SSDs are more concentrated around Samsung, Kingston, and WD, while HDDs are dominated by Seagate, WD, and Toshiba.
Windows Storage Is Entering The Next Stage: From "How Much Storage to Purchase" to "How to Use It"
In the first half of 2026, Windows storage is moving beyond simply seeking "higher capacity" toward "better system drive configuration, clearer storage allocation, and higher efficiency in utilizing available space". SSDs are increasingly becoming the main system drive, with 250 GB – 1TB remaining the mainstream capacity range. It's clear that storage capacity expansion and system space optimization are evolving in parallel.
Meanwhile, the physical storage capacity and the available system space are not the same. Windows users' storage experience increasingly depends on how available disk space is allocated and used.
As for the storage industry, the value of future storage devices and services is also shifting: from "merely providing storage capacity" to "all-round management services including disk performance optimization, disk space allocation, smart diagnostics for disk risk detection, and disk lifespan prolongation".
📝Overview: SSDs Are Becoming the "System Engine" of Windows, With HDDs Moving Forward as Secondary Storage
🔖Trend Insight:
SSDs have become the main storage medium for Windows system drives, accounting for 79.73% of physical drives that contain the C: drive, compared with 63.03% of all internal physical drives. Obviously, SSDs are now widely used for system installation and operating applications, while HDDs continue to serve a certain number of users with data storage demands.
However, this shift doesn't mean "SSDs are replacing HDDs". Instead, it shows an even clearer distinction in roles between those two types of disk drives: SSDs mainly support operating systems and performance-sensitive workloads, while HDDs continue to serve existing devices, secondary data storage, and high-capacity use cases.
⏳Foresight & Outlook:
The future of SSDs and HDDs may shift from "which disk type will replace the other" to "what role does each disk technology play": SSDs will continue to strengthen their roles in improving system performance, while HDDs will retain their advantages in data storage and high-capacity scenarios.
📝Overview: The Era of Ultra-Large Storage Hasn't Arrived: 250GB - 1TB Remains Mainstream Storage Capacity
🔖Trend Insight:
250GB -1TB remains the core capacity range for Windows storage. Although the total storage capacity continues to grow, 83.37% of internal physical drives are still smaller than 1TB. The 250GB - 500GB and 500GB - 1TB ranges of disk drives account for 57.10% of sample disks, showing that the mid-range capacity disks remain the dominant configuration. Yet, large-capacity disk drives are growing and haven't yet changed the overall storage structure.
⏳Foresight & Outlook:
In the forseeable period of the future, 250GB - 1TB disks will be the key capacity range for overserving and serving Windows storage needs. Storage upgrades are unlikely to simply move everything to ultra-large disk drives. Instead, demand for storage capacity will shift with different users' device configurations and usage scenarios, creating more distinct capacity tiers for different use cases.
📝Overview: A Larger Disk Drive Does Not Always Mean a Bigger C Drive
🔖Trend Insight:
The growth in total disk storage does not necessarily mean more system space. Windows storage observations should be classified into three aspects: the total internal storage, individual physical drive capacity, and the C drive capacity. According to the C drive capacity data, though the overall storage capacity continues to expand, 78.35% of C drives are still smaller than 500GB, leaving the mainstream system storage concentrated in the small-to-mid capacity range.
This means that having more physical storage on devices does not automatically transfer more available space to the system drive. Users' storage experience is still affected by system partition configuration and how the disk storage space is allocated.
⏳Foresight & Outlook:
The way to evaluate Windows storage experience may gradually shift from "How much storage capacity to have" to "How much available space does the system C drive actually have?" As a result, the relationship between physical capacity and system space will become an increasingly important factor in understanding storage experience and management needs.
📝Overview: Disk Management Is Evolving from Freeing Up Space to Identifying Problems In Advance
🔖Trend Insight:
Greater storage pressure will apparently show up when the C drive capacity gets smaller. Among the sample devices, 17.01% of disks have less than 10% free space on the C drive, and as C drives become smaller, the likelihood of entering this risk zone increases. This shows that system space has become an important factor in evaluating the Windows storage experience.
This change illustrates that storage management is moving beyond traditional tasks such as increasing partition size, partitioning drives, system and data migration, and disk cleanup toward early disk risk detection, disk space management, and storage structure optimization.
⏳Foresight & Outlook:
The value of future disk management may continuously shift from "solving insufficient space issues" to "identifying and managing storage risks in advance." Proactive capabilities for storage space risk detection, disk space management, and disk lifecycle management are likely to become increasingly important areas for the industry.
📝Overview: There Is No "Best" Drive Capacity for All Windows Users
🔖Trend Insight:
Global Windows users do not have a uniform storage capacity structure. The insights data shows that 500GB - 1TB is the leading capacity range in Europe, while 250GB - 500GB is the main range in both North America and Asia. Different regions are showing clear differences in storage capacity patterns.
Apparently, a single global capacity strategy may not fully address the diversified demands of storage devices in different markets. Regional storage patterns are becoming an important factor for PC manufacturers, storage hardware providers, and software companies when planning disk capacities and storage management experiences.
⏳Foresight & Outlook:
Global storage products and services may gradually move from a "standardized capacity strategy" to "regional capacity combinations + scenario-based storage management." Products and services could be tailored based on the mainstream capacity structures and usage scenarios of different regions.
What should the Storage Industry focus on next?
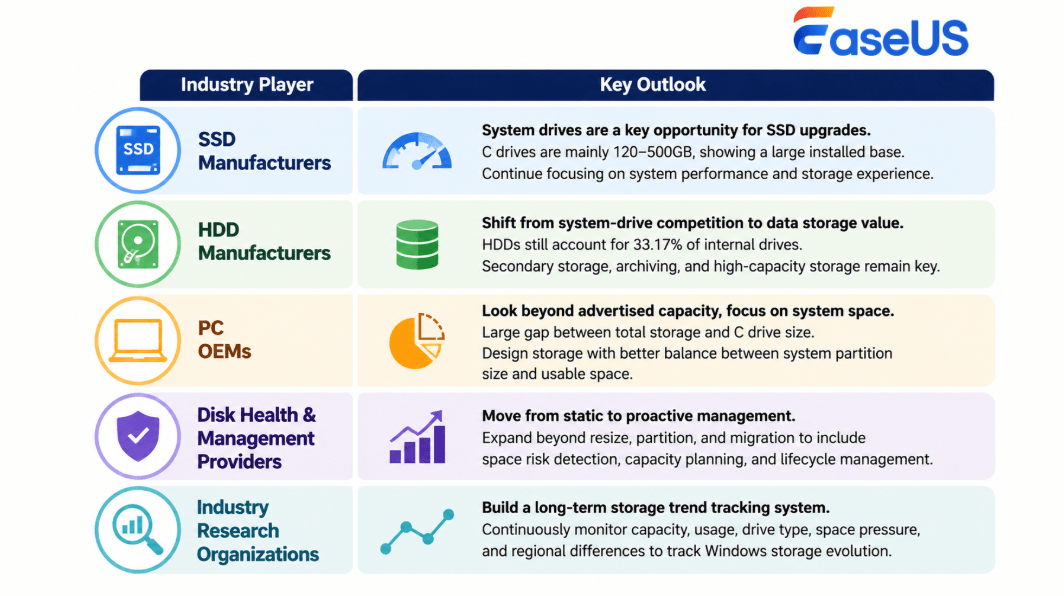
Based on the insights from nearly 3.8 million Windows sample users, the storage industry is shifting from simply relying on "storage capacity competition" to a new stage "focusing on storage roles, disk space efficiency, and disk management capabilities".
For different industrial providers, the opportunity in the next stage of the storage market is not simply to upgrade disks for more storage capacity, but to precisely identify users' actual storage structures and usage demands by providing better services.
|
|
Key Outlook |
|---|---|
|
|
|
|
|
|
|
|
|
|
|
|
|
|
|
💡Summary:
The next stage of Windows storage is not about simply "having a larger drive," but about making better use of and allocating the storage space available on the disk.
As SSDs become more common as system drives, multi-drive configurations spread, and C drive space pressure remains, the storage industry's value is gradually shifting from hardware capacity competition to space optimization, risk management, and storage lifecycle management.
Risk-Based Windows Disk Management Suggestions: Shift from "Is My Storage Enough?" to "How Should I Manage It?"
C drive capacity and space pressure show a clear pattern: the smaller the C drive, the higher the risk of running out of space. However, the statistics do not suggest using a single capacity range to define and standardize all Windows users. A more practical option is to manage disk storage based on device usage, storage structure, and actual space needs.
Based on these findings, EaseUS Partition Master experts recommend a tiered approach to disk management:
C Drive Below 120GB: Reduce Space Pressure First, Then Consider Disk Upgrade
🚩Recommended Actions:
🧑🏻🔬Expert Recommendation:
For C drives below 120GB, free up enough space as soon as possible instead of squeezing more data into limited space. If storage pressure persists, upgrading or migrating to a larger SSD may provide greater long-term value than repeatedly cleaning up the system disk space.
250 - 500GB: Usually Enough for Everyday Use, but Active Management Still Matters
🚩Recommended Actions:
🧑🏻🔬Expert Recommendation:
250GB - 500GB disk capacity is still suitable for most Windows users based on regular usage, but this does not mean storage management can be ignored. By separating system and personal data via a multi-drive configuration effectively, and checking free space regularly, users can effectively extend the lifespan of disks in this capacity range.
Larger Storage Requires Better Management: From "Is Storage Space Enough" to "How Should the Space Be Allocated"
🚩Recommended Actions:
🧑🏻🔬Expert Recommendation:
For users who are using 500GB or bigger disks, they shouldn't simply add more capacity as the only solution. Instead, big disk drive owners should focus on giving existing storage clear and efficient roles, supported by partition planning, health monitoring, and regular backups.
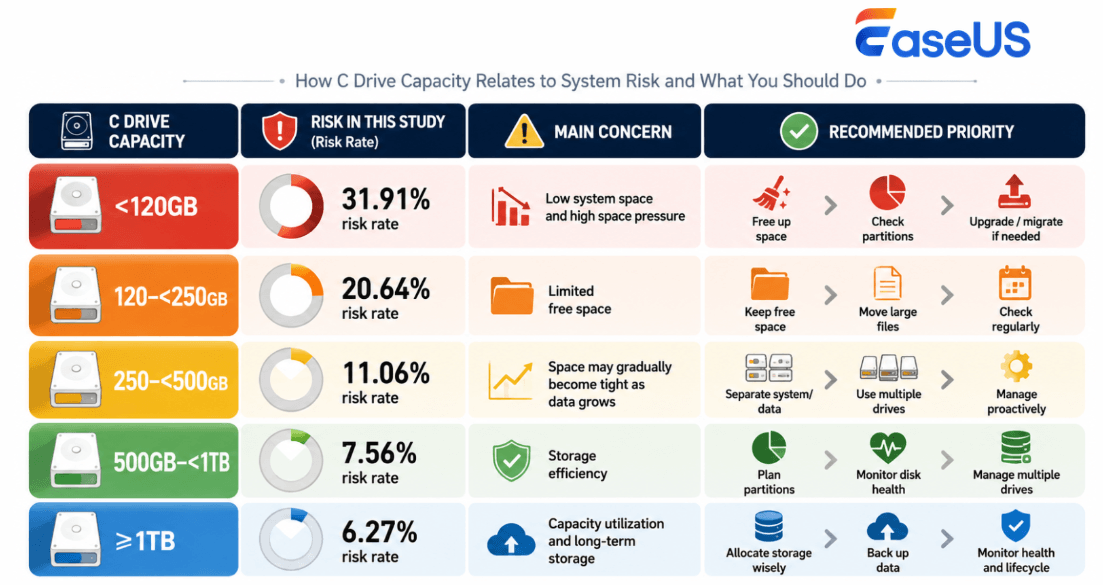
Based on the capacity distribution and C drive space-pressure data in this study, Windows users can follow a simple risk-based management approach:
| C Drive Capacity | Risk in This Study | Main Concern | Recommended Priority |
|---|---|---|---|
| <120GB | 31.91% risk rate | Low system space and high space pressure | Free up space → Check partitions → Upgrade/migrate if needed |
| 120–<250GB | 20.64% risk rate | Limited free space | Keep free space → Move large files → Check regularly |
| 250–<500GB | 11.06% risk rate | Space may gradually become tight as data grows | Separate system/data → Use multiple drives → Manage proactively |
| 500GB–<1TB | 7.56% risk rate | Storage efficiency | Plan partitions → Monitor disk health → Manage multiple drives |
| ≥1TB | 6.27% risk rate | Capacity utilization and long-term storage | Allocate storage wisely → Back up data → Monitor health and lifecycle |
The smaller the C drive, the more urgently users should address space pressure. In the 250GB-500GB range, users should shift focus to active space management. When disk drive capacity goes above 500GB, users should increasingly focus on disk storage allocation and planning, reasonable storage roles, and long-term disk health.
Was This Page Helpful?
More from EaseUS
Why Your SD Cards Are Failing & Why Old Recovery Methods Are Obsolete
 Finley/2026-06-16
The New Era of Personal Data Protection: From Local Backup to Integrated Cloud Management
 Larissa/2026-06-18
Windows System Drive Usage Report (Trends/Habits/Challenges) 2025 Q1: A Data-Driven Perspective
 Tracy King/2026-08-14
Data Storage Statistics, Facts, and Trends for 2025
Larissa/2026-07-03
Copyright © EaseUS. All rights reserved.


